|
DemoSat /
FinalReportNote: You can download this report in Microsoft Word or OpenOffice.org formats. DemoSat IV final report FieldSat/SolarSatRecord orientation and acceleration information during flight. Deploy solar panels and record their efficiency.  Students
Faculty advisor
Metropolitan State College of Denver August 9, 2006 Mission statementOur mission is a combination of FieldSat and SolarSat. As such, our goals are to record orientation and vibration data and to deploy solar panels during flight. Additionally, we wish to develop a novel and realistic method to visualize the data that are recorded. We will make public any data we obtain for the benefit of future teams. We will develop code that may be useful for future projects. Mission requirements and descriptionThe FieldSat mission objectives, according to the mission description, are that on-board sensors record orientation and vibration information during flight, and that we test instrumentation prototypes for use in later missions. The data should be recorded on a micro cassette recorder for a large capacity storage. (We interpreted the "micro cassette recorder" requirement to mean we could use any large-capacity storage, for which we substituted Secure Digital cards.) The SolarSat mission objective is to deploy solar panels during flight and determine their efficiency. There many ways "deploy" could be interpreted. We decided that changing the orientation of the solar panels sometime during the flight would be sufficient. That way, we could compare their efficiency before and after the deployment. To measure the panels' efficiency, we would need to record, at a minimum, the voltage supplied by the panels and the available sunlight. These data should be recorded in the same manner as the data from the FieldSat. The data storage should include some degree of redundancy to increase the chances of recovering useful data. The only part of the payload that must survive after touchdown is the data storage. The survival of anything else would be nice, but can be considered unnecessary for the success of the mission. The entire payload must have a mass less than 1.8 kg. Payload designOverviewOur combined FieldSat/SolarSat consists of a microcontroller, an inertial measurement unit, memory card sockets and cards to go in them, light sensors, solar panels, and a servo to deploy the panels. These are connected as shown below. There are also some heaters, which are independent of the rest of the system. All these are enclosed in a housing. 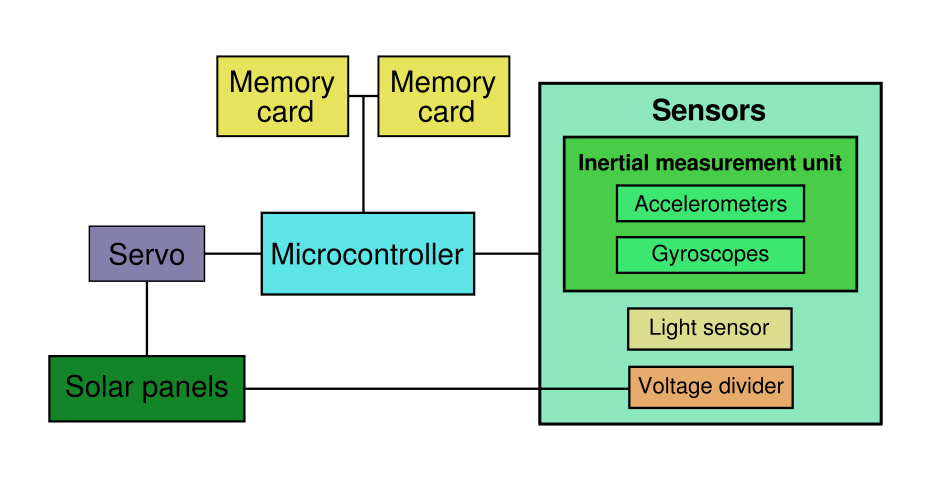 FieldSatThe heart of the FieldSat is the ATmega32 microcontroller from Atmel. We got the chip on a ready-made control board from Futurlec. The microcontroller runs the programs that controls all the functions of the payload. It has analog-to-digital converters that we use to read from the sensors. One of its pulse-width modulation channels is used to control the servo. The FieldSat's inertial measurement unit consists of three angular rate gyroscopes and three linear accelerometers. The gyro-accelerometer pairs are mounted on the interior walls of the package on mutually perpendicular axes. (It should be noted that in choosing this design for the FieldSat, we also satisfied some of the requirements of the IMUSat.) The sensors we chose were the ADXRS300 angular rate sensor and the ADXL320 accelerometer, both from Analog Devices. The gyroscopes have a range of ±300° / s and the accelerometers have a range of ±5 g. (We actually found that the ranges of our gyroscopes and accelerometers were greater than advertised, about ±475° / s and ±8.5 g, respectively). These sensors are made with Microelectromechanical Systems (MEMS) technology. They are very small and light (so small and light, in fact, that we had to order them in evaluation board versions so they would be big enough to work with). There are two memory card sockets, each in a different part of the payload. Both cards are written with identical data during the flight. That way, if one breaks on impact, we can still recover data from the other one. Also, if the two cards contain different data, we know at least that something went wrong, which we would not be able to tell from just one card. The program that runs on the microcontroller is 1,100 lines of expertly written C code. It samples the various sensors 100 times per second and writes the readings to both memory cards. The program incorporates a timer. After 80 minutes, it activates the servo to deploy the solar panels. All of the FieldSat electronics as well as the SolarSat's servo are powered by one 9-volt battery. Our tests showed that the current used when activating the servo was not enough to reset the microcontroller. SolarSatThe solar panels are two 10-inch by 6-inch thin-film cells. They are attached to a wire backing for rigidity. They connect to the rest of the package at the top with hinges. The panels are deployed by a servo that pulls strings of braided Dacron. The servo is controlled by the microcontroller and is set to deploy 80 minutes after being powered on. The panels are locked into position and the servo deactivates five seconds later to reduce the power it consumes. The locks are drywall anchors which flip down and catch tabs at the tops of the solar panels. The SolarSat has two sensors that are sampled by the microcontroller. The first is a photoresistor that measures available light. The other is the actual voltage produced by the panels, which is run through a voltage divider to constrain it to the range needed by the microcontroller's analog-to-digital converters. These two sensors allow us to measure the panels' efficiency by comparing the voltage produced to available light. HeatingWe have two resistor-based heaters. Each one is five 10-Ohm resistors in series, connected to two 9-volt batteries. Housing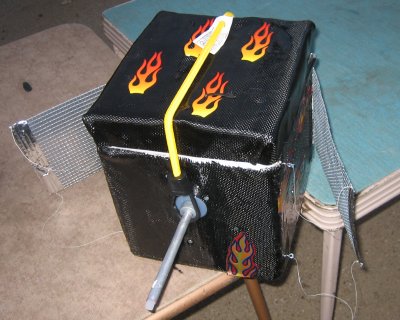 All our electronics are enclosed in a styrofoam box, which is roughly cubical, about 10 inches on a side. The box is encased in carbon fiber and epoxy. The carbon fiber provides a rigid surface to which things can be attached, something the foam could not do on its own. We applied flame decals to the outside of the housing; we estimate these improve our payload's performance by as much as 10%. The tether pole is an aluminum tube that extends far enough above and below the package to keep the tether from interfering with our solar deployment mechanism. The lid is held in place by a bungee cord that connects to the tether pole. Design changes during developmentWe had wanted to include more sensors on the FieldSat, including 18-g accelerometers to go with our 5-gs, internal and external temperature sensors, and a pressure sensor with which to measure altitude. We had the parts for and tested each of these sensors on their own, but couldn't include them in the final design because the ATmega32 has only eight analog inputs. We knew about this and acquired some external AD7859 analog-to-digital converters, but we could not make them work. So we included only the most essential sensors and omitted these others. We originally planned to complete the VideoSat mission as well. This would have involved putting a small video camera with SD card storage somewhere in the payload, with a small window to the outside. We bought a suitable camera, but due to a suspected manufacturing defect, it would not write to an SD card, only to its internal memory. The internal memory was enough to record only about 30 seconds of video. We were not able to make the camera work and we did not have enough time to find a replacement, so we removed the VideoSat from the final design. Expected dataThe data we record are written to the memory cards in 32-byte packets. Each packet contains a timestamp, which is a 32-bit integer representing a number of ticks of the ATmega32's 16 MHz clock (the timestamps overflow about every four and a half minutes). Followed by the timestamp is the two-byte sample type. There are different sample types for different data, even though we ended up not using more sensors. This is followed by various data, typically two-byte values from the analog-to-digital converters. One of the sample types indicates that the solar panels have deployed. With 32-byte samples, at 100 samples per second, we record about 11 MB of data every hour. BudgetsOur final mass, with batteries, was 1.6 kg. This was above our goal of 1.5 kg, but still under the limit of 1.8 kg. We spent $756.09. This was under our limit of $900. The cost was fairly evenly distributed between the three missions. Student involvement
There were two members who were active at one time but were not by the end of the project. These team members were part of the SolarSat and VideoSat projects. Testing resultsPressure and battery life testWe conducted a test of battery life and our pressure sensor on June 28. The FieldSat electronics were taken up a mountain to about 13,000 feet. A brand new 9 volt alkaline battery allowed the device to record for more than seven hours before it was switched off. It recorded 79 MB of data at 100 samples per second. The pressure sensor has an output range of only 0–20 mV, far less than the 0–5 V range of our analog-to-digital converters, and we had not made an amplifier for the signal. This means that the pressure sensor's full range of 0–100 kPa is quantized by our 10-bit ADCs into only five discrete values! For this test of limited pressure difference, only two different values were recorded. The only redeeming feature is that the pressure sensor's output fluctuates between the two values when it is near their boundary. By averaging successive values, it is possible to get a reasonably smooth picture of the pressure over time. Using the formula h = 15500 × (5 − log10(P)), we produced this graph of altitude: 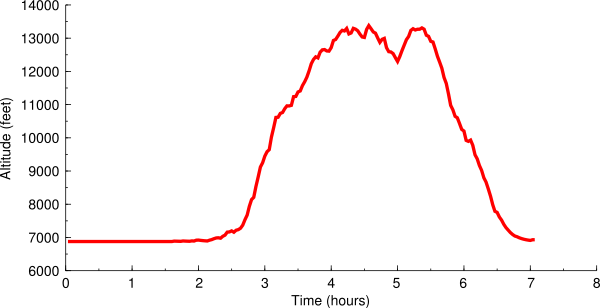 Visible is a place where the payload descended and reascended to get around an obstacle. Because of the limited resolution mentioned above, only two distinct altitudes were measured: 6,900 feet and 15,800 feet. These were averaged to get the graph shown. We had planned to use the pressure sensor to control the deployment of the solar panels; however, because of the aforementioned lack of analog channels, it was omitted from the final design. Cold testsWe performed three cold tests. The first was done in a −80° C freezer. We placed the package in the freezer for about 45 minutes, taken out, and allowed to run for a bit longer. The package's temperature dropped to about 5° F according to out temperature sensor. By the end of this test, our heaters had stopped working. The memory card we used had bad sectors on it at about 9 MB, or 48 minutes, so we did not recover any data after that point. Our second test was similar, in the same freezer, this time for about an hour. This time, there was a gap in the data starting while the package was in the freezer and ending some time after we had taken it out again. We suspect the batteries got cold and stopped working, causing the microcontroller to shut off until they warmed up again. Our third cold test was in a cooler with dry ice per the DemoSat guidelines. We sealed up the package for about four and a half hours. 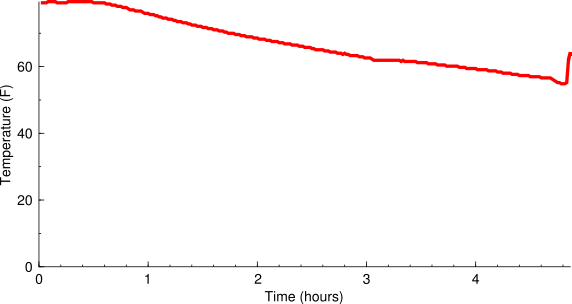 This time we used more batteries for the heaters. The package stayed much warmer. The rise at the end of the graph is after we took it out of the cooler. We also tested the light sensor for the first time during this test. 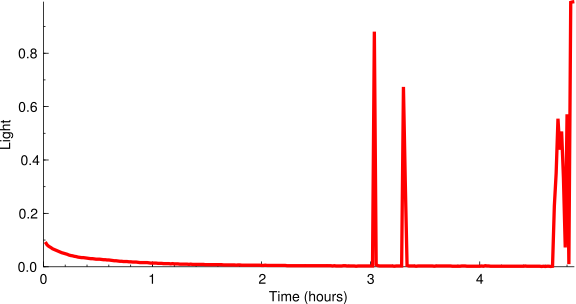 The package stayed in the dark except for a few times the lid of the cooler was opened to check on it, and when we took it out at the end. Whip testWe performed the whip test per the DemoSat guidelines. We whipped the payload around for about a minute. The test was successful; we were able to recover and visualize the data and there was no damage. Mission ResultsPhysical conditionWe were not able to recover our payload personally, because it was too far from the nearest public road. It was delivered to us some hours after it landed. This picture was taken by the team that recovered it: 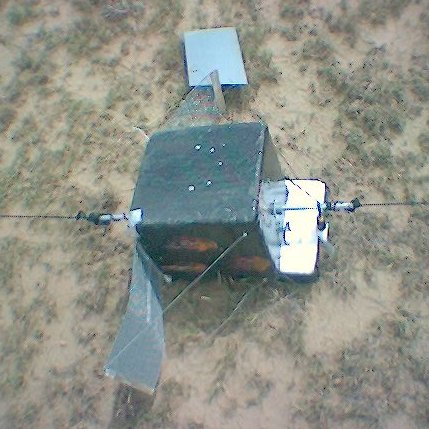 One of the solar panels had broken out of its chicken-wire holder. This apparently happened right at impact, because the panel was found nearby. The tabs that connected the panels to the string going to the servo were bent outward to a remarkable degree. The lid of the payload was ajar. The bungee cord had held it on, but it was shifted to one side. Removing the lid, we found that the heaters were still working. One of the terminals connecting the battery to the microcontroller was disconnected, and the battery had gotten loose from where we had fastened it. When the lid was knocked askew, it ripped the memory card reader embedded in it away from the main board, bending the pins we had used to connect it. There were shallow dents in the interior walls, possibly caused by the stray battery bouncing around. Data recoveryWe put the memory cards in a computer as soon as we could get them out of the payload. One of the cards was unreadable, presumably damaged in the flight. The other contained 24 MB of data, spanning an interval of 2:10:55 hours. We determined that this covered not quite the entire flight, starting when we powered on the system before launch and ending some time after the burst. It's possible that the disconnected battery was responsible for the premature end of data recording. FieldSatUsing our visualization program, we were able to make a video spanning the entire time the payload was active. We put the video on DVD so it can be easily distributed. Sample output from the visualization program is shown below. 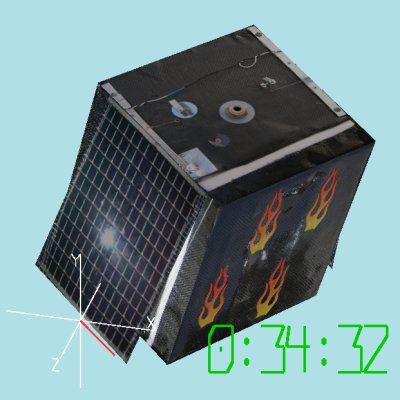 This video is the main result of our FieldSat mission, but because of its size it cannot be included in this report. A copy can be obtained by contacting one of our team members through the web site whose address is given below under “Conclusions”. Twice during the flight, one of our two-axis accelerometers gave bad readings for a while. Our accelerometer measuring the payload's Y and Z axes read 8.5 gs from 1:16:19 to 1:50:00 and again from 2:08:52 until 2:10:55, the end of the flight. These faulty readings correspond to a maximum voltage on the analog input channels. This could have been caused by a loose wire. We don't know why, after the accelerometer malfunctioned, it began to work again for a while. It started to work again right at the time of the burst, so maybe all the shaking knocked something back into position. SolarSatOur solar voltage and luminosity sensors worked the entire time. Here is a graph showing their comparative readings: 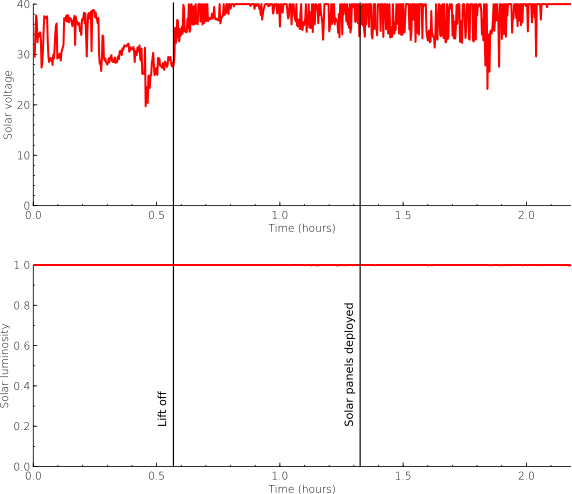 Unfortunately, we had miscalibrated our light sensor. We configured it to give its maximum reading when it was indoors, near a light bulb. It was brighter than that for the whole time of the flight, so our light sensor was pegged at maximum or very near it the whole time. So we were not able to record any meaningful changes in light intensity. We did record varying readings from the solar panels. They are somewhat lower near the beginning of the flight, perhaps because it was cloudier then, and the package was lying on its side on a table. The readings also fluctuate quite rapidly almost everywhere. We believe this is because of the changing orientation of the panels as they were rotating. The deployment of the solar panels did not have an observable effect. Despite being detached from the payload and bent somewhat, the solar panels still worked as they did before the flight. StatisticsThese are statistics we collected from the sensors. These omit the faulty readings we occasionally got from two axes of the accelerometers.
TimelineBy combining our time recordings with observations from the video and the EOSS flight recap, we created this schedule of events.
Our estimate for the burst is within one minute of the EOSS time, which was 9:06:59 AM. ConclusionsWe had originally hoped that our sensors would be sensitive enough and our signal processing skills great enough that we could numerically integrate our readings and recreate a map of the flight. While this turned out not to be possible, we were able to accurately recreate the payload's orientation, rate of rotation, and vibration. To our knowledge, this is the first time a visualization like the one we made has been produced. Although the data contain anomalies (the accelerometer malfunction mentioned above), we believe our video could be valuable to future DemoSat teams. The thin-film solar panels we chose were able to produce fairly reliable power during the flight. We showed that we were able to deploy the panels in the air. The panels were able to survive a violent crash and could potentially be used again. Memory cards like the ones we used are a low-cost, high-capacity, fairly reliable data storage device. They can be used with any microcontroller that supports the Serial Peripheral Interface (SPI). All our results, the visualization, and all of our source code are available on our project web site at http://www.bamsoftware.com/wiki/DemoSat. Potential follow-on workThe system architecture and data storage format we developed are quite flexible, and could support many more sensors, as we had originally planned. Redoing this mission with more analog-to-digital converters and a variety of lightweight sensors could provide many useful results in one payload. The energy from the solar panels wasn't put to any good use. It could be used to charge the system's batteries or power a heater. Though we rose to the challenge of deploying the solar panels while in flight, we believe it would be simpler and just as effective to simply affix the panels to the side of the package. More meaningful results could be obtained through better signal processing. The signals we receive from our sensors are noisy, biased, and otherwise hard to deal with. They require filtering and other processing before they can give a useful picture of what happened during the flight. Our filters could no doubt be improved, owing to our inexperience. One of our planned ambitious goals was to integrate the acceleration data and make a graph showing the payload's flight path. We were not able to do this because we could not adequately control signal noise and integration drift. Another solution would be to combine our inertial measurement unit with a GPS receiver. This would give us the stability of GPS with accurate interpolation between GPS readings. It's conceivable that we could know the payload's location within less than a meter with such a system. The data we collected were written directly to the memory cards sector by sector, without using any kind of filesystem. This made it impossible to recover the data using a computer running the Windows operating system, which doesn't provide an easy way to access devices at a sector level (we recovered the data using GNU/Linux, which does provide such access). It may not be too hard to write the data in a rudimentary FAT filesystem to improve its accessibility. Benefits to NASA and scientific communityThe inertial measurement unit in the FieldSat could be used for navigation over short distances when an external position reference such as GPS is not available. The three-dimensional visualization program could be a valuable scientific tool. Seeing an accurate model move on the screen is an intuitive way to look at and understand data. By publishing the source code of our on-board program and visualization programs, we allow others to use and improve on our work. Even for teams trying missions different from the ones we chose, parts of the programs, like the memory card writing and the serial output, could be generally useful. Our results from the SolarSat can show how the efficiency of solar cells can be expected to fluctuate as they rapidly change their orientation. Lessons learnedWe should have insisted on better technical support from our video camera supplier. When our camera didn't work, we couldn't get adequate help with it. Our team started construction of the payload too late. Coming to consensus on design decisions earlier and enforcing the schedule would have given us more time to build and test the payload. |